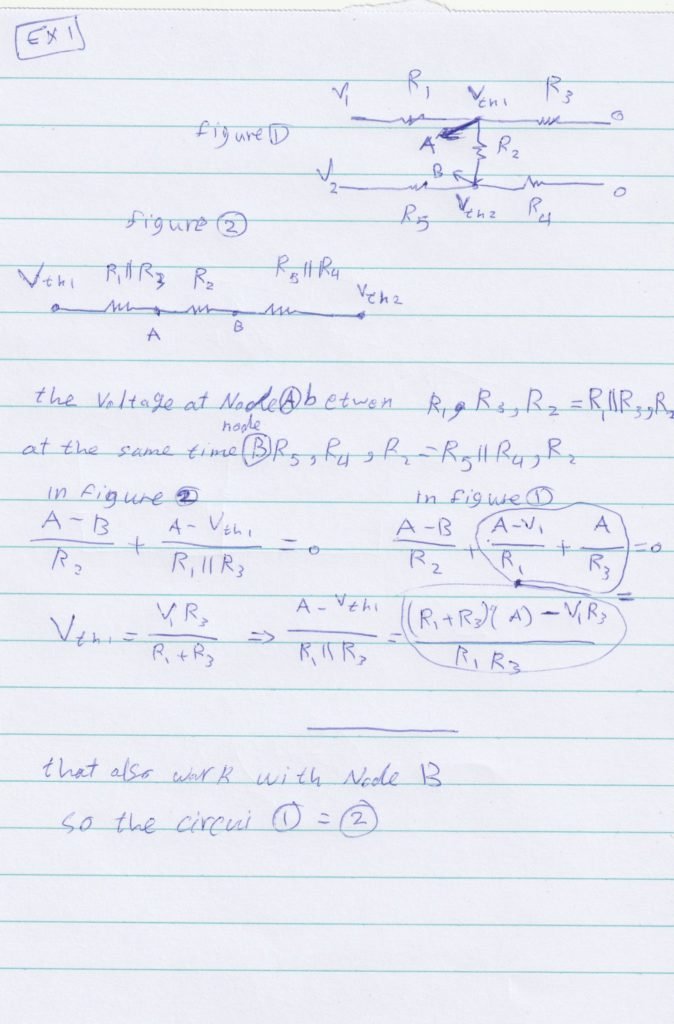
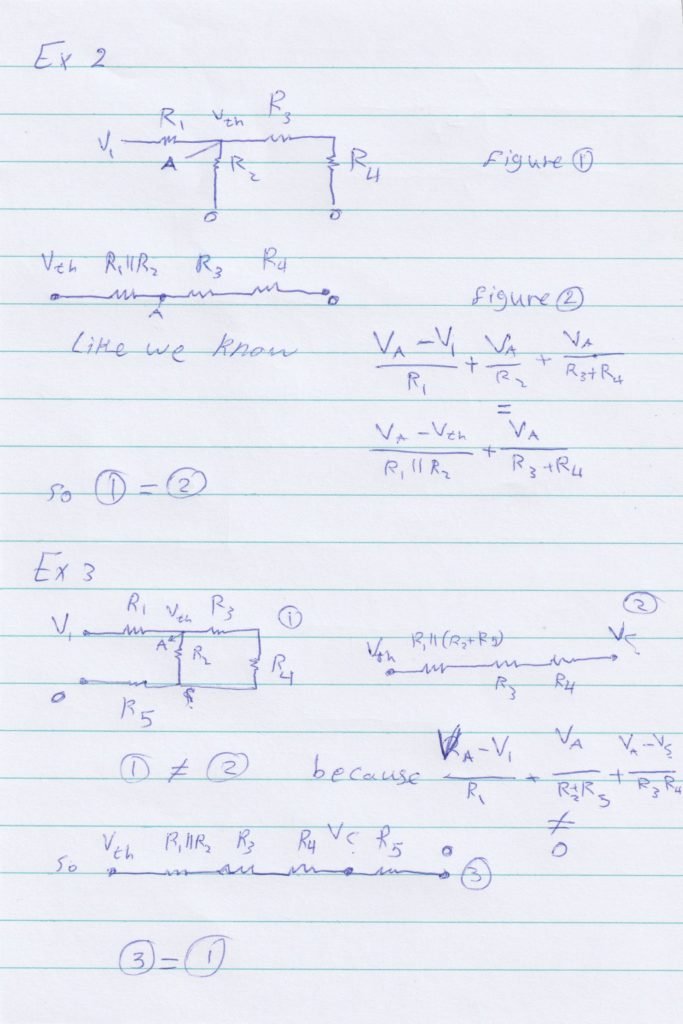

Ex4
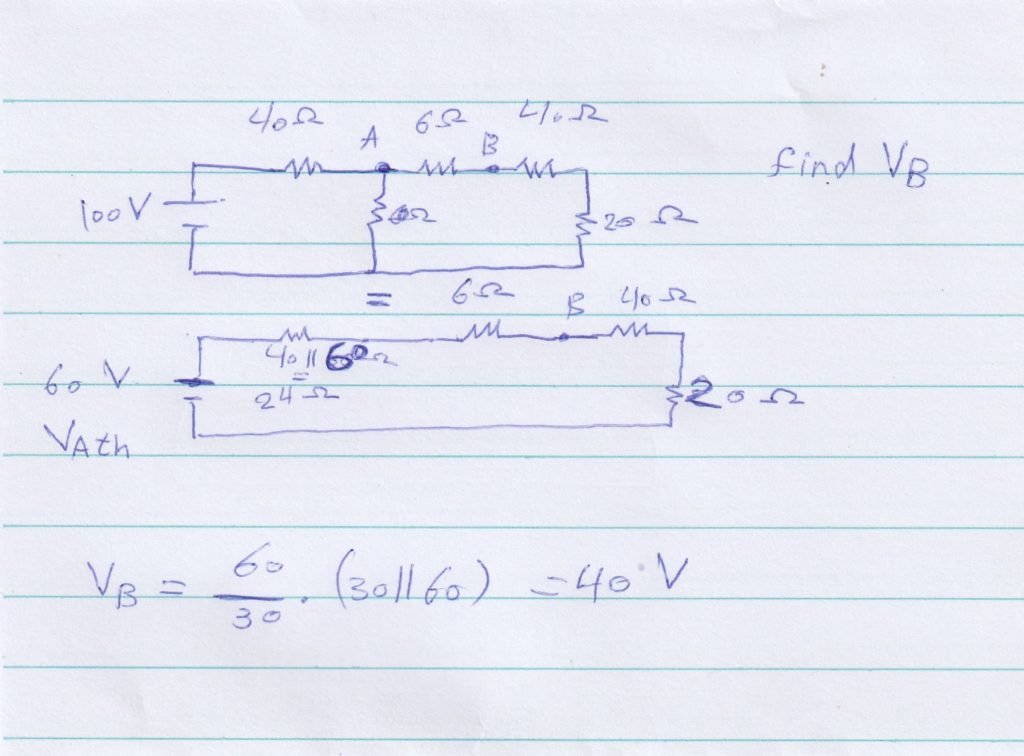
ex5
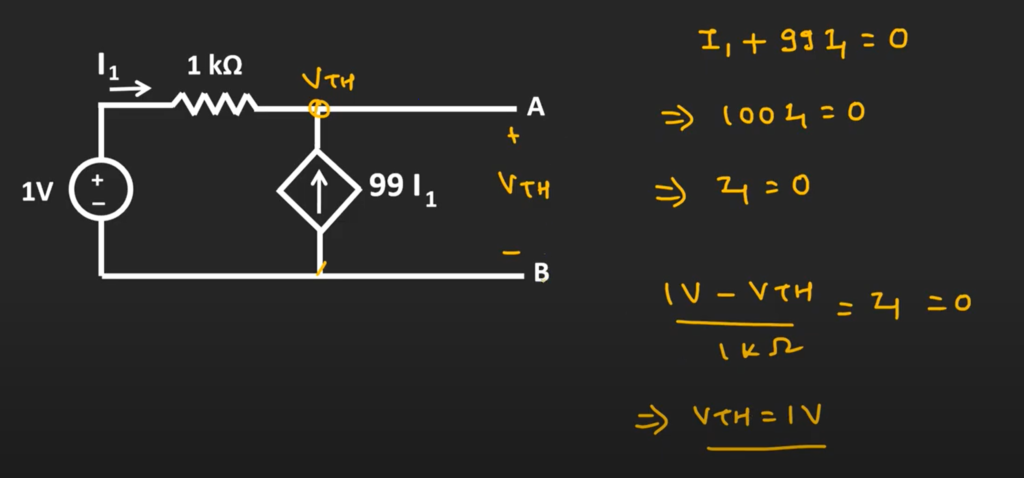
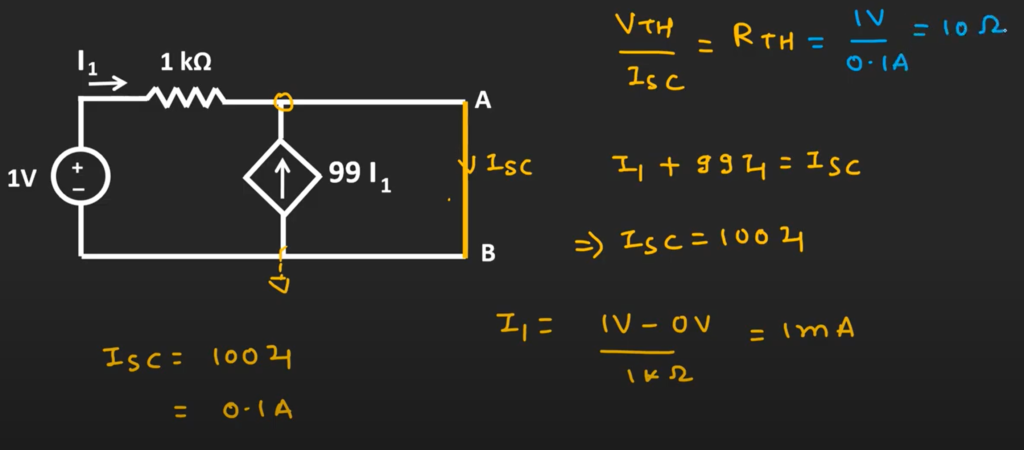
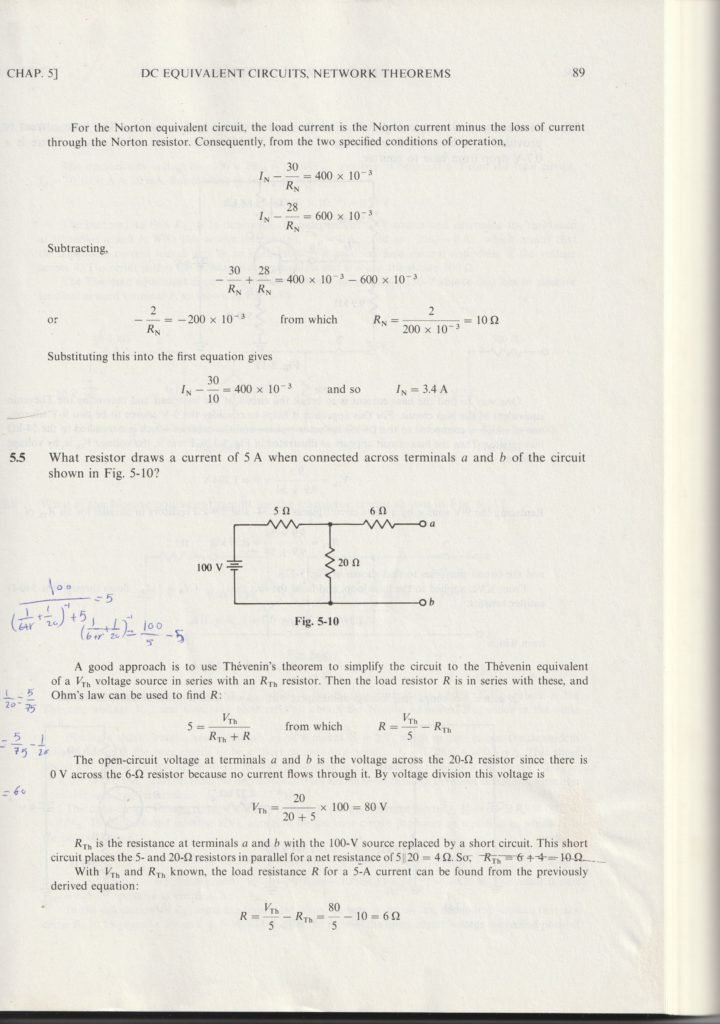
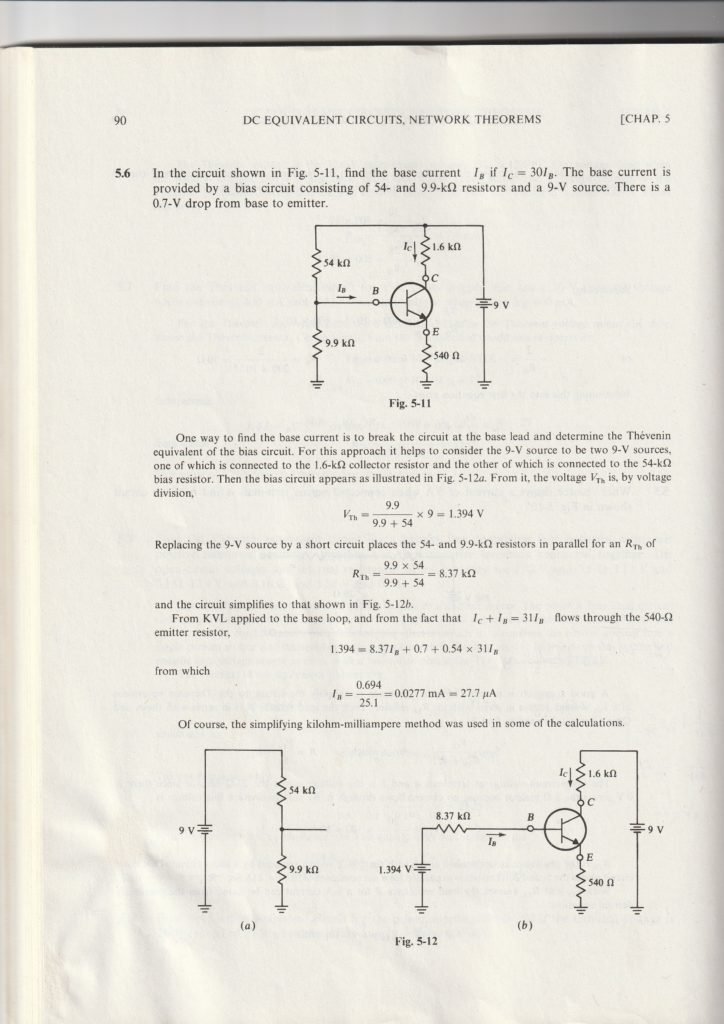
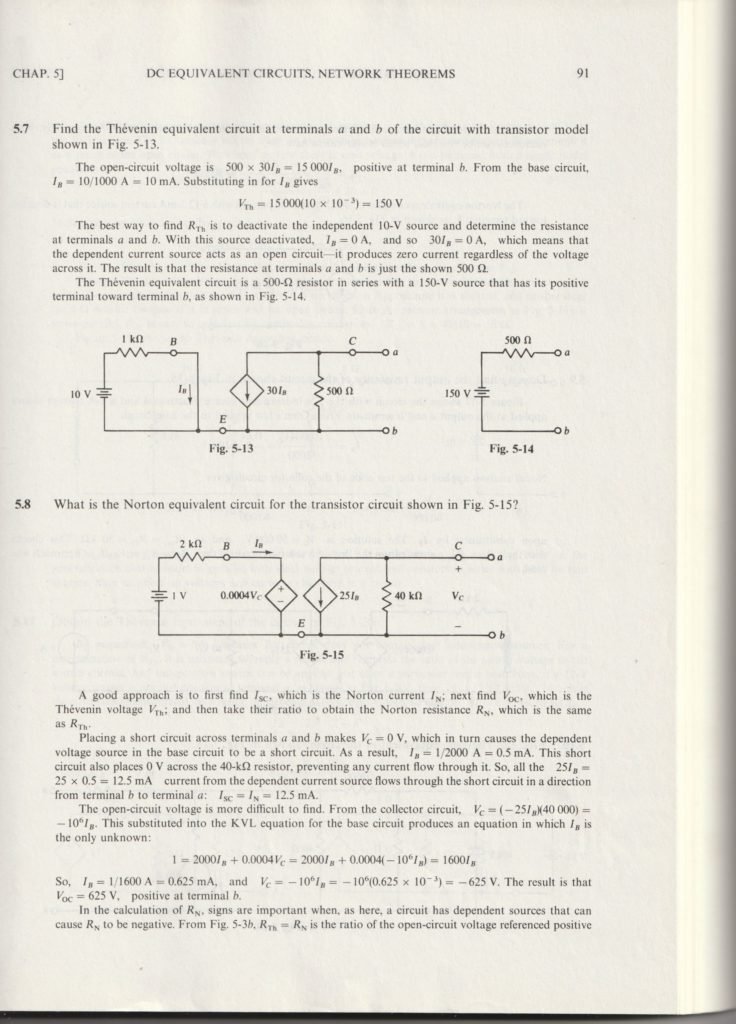
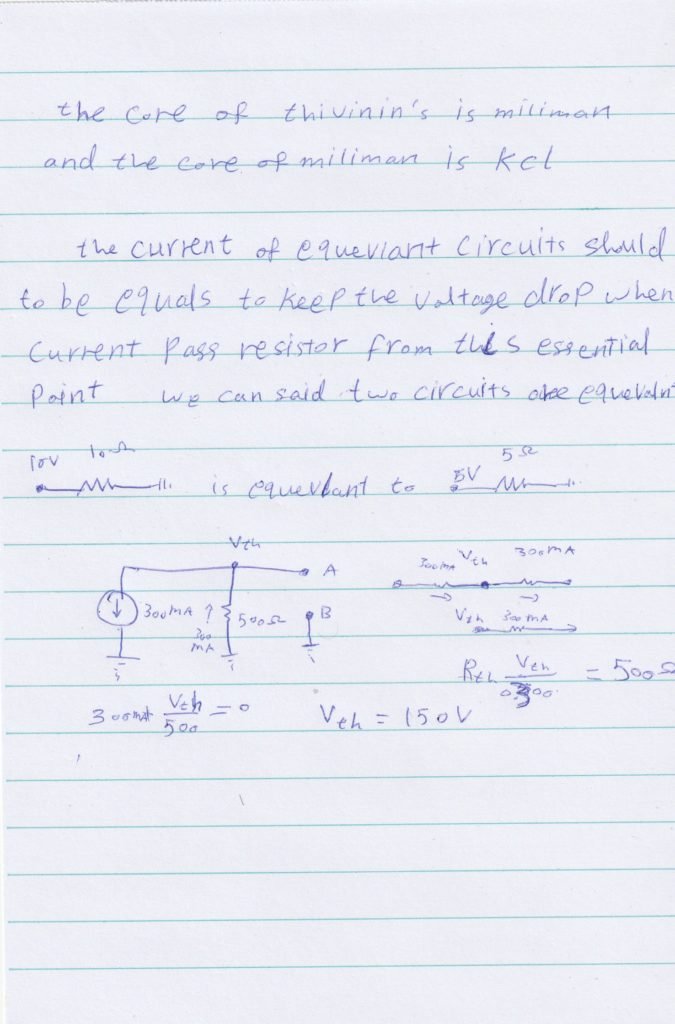


Ex4

ex5


Q1

Q2

Q3


Q4


Q5


Q6 and Q7

Q8


There are several equations used to convert one network to the other:

Δ and Y networks are seen frequently in 3-phase AC power systems (a topic covered in volume II of this book series), but even then they’re usually balanced networks (all resistors equal in value) and conversion from one to the other need not involve such complex calculations. When would the average technician ever need to use these equations?
A prime application for Δ-Y conversion is in the solution of unbalanced bridge circuits, such as the one below:

The solution of this circuit with Branch Current or Mesh Current analysis is fairly involved, and neither the Millman nor Superposition Theorems are of any help since there’s only one source of power. We could use Thevenin’s or Norton’s Theorem, treating R3 as our load, but what fun would that be?
If we were to treat resistors R1, R2, and R3 as being connected in a Δ configuration (Rab, Rac, and Rbc, respectively) and generate an equivalent Y network to replace them, we could turn this bridge circuit into a (simpler) series/parallel combination circuit:

After the Δ-Y conversion . . .

If we perform our calculations correctly, the voltages between points A, B, and C will be the same in the converted circuit as in the original circuit, and we can transfer those values back to the original bridge configuration.


Resistors R4 and R5, of course, remain the same at 18 Ω and 12 Ω, respectively. Analyzing the circuit now as a series/parallel combination, we arrive at the following figures:

We must use the voltage drops figures from the table above to determine the voltages between points A, B, and C, seeing how they add up (or subtract, as is the case with the voltage between points B and C):


Now that we know these voltages, we can transfer them to the same points A, B, and C in the original bridge circuit:

Voltage drops across R4 and R5, of course, are exactly the same as they were in the converter circuit.
At this point, we could take these voltages and determine resistor currents through the repeated use of Ohm’s Law (I=E/R):


Nodal Voltage Analysis complements the previous mesh analysis in that it is equally powerful and based on the same concepts of matrix analysis. As its name implies, Nodal Voltage Analysis uses the “Nodal” equations of Kirchhoff’s first law to find the voltage potentials around the circuit.
So by adding together all these nodal voltages the net result will be equal to zero. Then, if there are “n” nodes in the circuit there will be “n-1” independent nodal equations and these alone are sufficient to describe and hence solve the circuit.
At each node point write down Kirchhoff’s first law equation, that is: “the currents entering a node are exactly equal in value to the currents leaving the node” then express each current in terms of the voltage across the branch. For “n” nodes, one node will be used as the reference node and all the other voltages will be referenced or measured with respect to this common node.
For example, consider the circuit from the previous section.

In the above circuit, node D is chosen as the reference node and the other three nodes are assumed to have voltages, Va, Vb and Vc with respect to node D. For example;

As Va = 10v and Vc = 20v , Vb can be easily found by:

again is the same value of 0.286 amps, we found using Kirchhoff’s Circuit Law in the previous tutorial.
From both Mesh and Nodal Analysis methods we have looked at so far, this is the simplest method of solving this particular circuit. Generally, nodal voltage analysis is more appropriate when there are a larger number of current sources around. The network is then defined as: [ I ] = [ Y ] [ V ] where [ I ] are the driving current sources, [ V ] are the nodal voltages to be found and [ Y ] is the admittance matrix of the network which operates on [ V ] to give [ I ].
The basic procedure for solving Nodal Analysis equations is as follows:
We have now seen that a number of theorems exist that simplify the analysis of linear circuits. In the next tutorial we will look at Thevenins Theorem which allows a network consisting of linear resistors and sources to be represented by an equivalent circuit with a single voltage source and a series resistance.

The above LR series circuit is connected across a constant voltage source, (the battery) and a switch. Assume that the switch, S is open until it is closed at a time t = 0, and then remains permanently closed producing a “step response” type voltage input. The current, i begins to flow through the circuit but does not rise rapidly to its maximum value of Imax as determined by the ratio of V / R (Ohms Law).
This limiting factor is due to the presence of the self induced emf within the inductor as a result of the growth of magnetic flux, (Lenz’s Law). After a time the voltage source neutralizes the effect of the self induced emf, the current flow becomes constant and the induced current and field are reduced to zero.
We can use Kirchhoff’s Voltage Law, (KVL) to define the individual voltage drops that exist around the circuit and then hopefully use it to give us an expression for the flow of current.
Kirchhoff’s voltage law (KVL) gives us:

The voltage drop across the resistor, R is I*R (Ohms Law).

The voltage drop across the inductor, L is by now our familiar expression L(di/dt)

Then the final expression for the individual voltage drops around the LR series circuit can be given as:

We can see that the voltage drop across the resistor depends upon the current, i, while the voltage drop across the inductor depends upon the rate of change of the current, di/dt. When the current is equal to zero, ( i = 0 ) at time t = 0 the above expression, which is also a first order differential equation, can be rewritten to give the value of the current at any instant of time as:

The Time Constant, ( τ ) of the LR series circuit is given as L/R and in which V/R represents the final steady state current value after five time constant values. Once the current reaches this maximum steady state value at 5τ, the inductance of the coil has reduced to zero acting more like a short circuit and effectively removing it from the circuit.
Therefore the current flowing through the coil is limited only by the resistive element in Ohms of the coils windings. A graphical representation of the current growth representing the voltage/time characteristics of the circuit can be presented as.


Since the voltage drop across the resistor, VR is equal to I*R (Ohms Law), it will have the same exponential growth and shape as the current. However, the voltage drop across the inductor, VL will have a value equal to: Ve(-Rt/L). Then the voltage across the inductor, VL will have an initial value equal to the battery voltage at time t = 0 or when the switch is first closed and then decays exponentially to zero as represented in the above curves.
The time required for the current flowing in the LR series circuit to reach its maximum steady state value is equivalent to about 5 time constants or 5τ. This time constant τ, is measured by τ = L/R, in seconds, where R is the value of the resistor in ohms and L is the value of the inductor in Henries. This then forms the basis of an RL charging circuit were 5τ can also be thought of as “5*(L/R)” or the transient time of the circuit.
The transient time of any inductive circuit is determined by the relationship between the inductance and the resistance. For example, for a fixed value resistance the larger the inductance the slower will be the transient time and therefore a longer time constant for the LR series circuit. Likewise, for a fixed value inductance the smaller the resistance value the longer the transient time.
However, for a fixed value inductance, by increasing the resistance value the transient time and therefore the time constant of the circuit becomes shorter. This is because as the resistance increases the circuit becomes more and more resistive as the value of the inductance becomes negligible compared to the resistance. If the value of the resistance is increased sufficiently large compared to the inductance the transient time would effectively be reduced to almost zero.
A coil which has an inductance of 40mH and a resistance of 2Ω is connected together to form a LR series circuit. If they are connected to a 20V DC supply.
a). What will be the final steady state value of the current.

b) What will be the time constant of the RL series circuit.

c) What will be the transient time of the RL series circuit.

d) What will be the value of the induced emf after 10ms.

e) What will be the value of the circuit current one time constant after the switch is closed.

The Time Constant, τ of the circuit was calculated in question b) as being 20ms. Then the circuit current at this time is given as:

You may have noticed that the answer for question (e) which gives a value of 6.32 Amps at one time constant, is equal to 63.2% of the final steady state current value of 10 Amps we calculated in question (a). This value of 63.2% or 0.632 x IMAX also corresponds with the transient curves shown above.
Then from above, the instantaneous rate at which the voltage source delivers power to the circuit is given as:

The instantaneous rate at which power is dissipated by the resistor in the form of heat is given as:

The rate at which energy is stored in the inductor in the form of magnetic potential energy is given as:

Then we can find the total power in a RL series circuit by multiplying by i and is therefore:

Where the first I2R term represents the power dissipated by the resistor in heat, and the second term represents the power absorbed by the inductor, its magnetic energy.

These voltage and current waveforms show that for a purely inductive circuit the current lags the voltage by 90o. Likewise, we can also say that the voltage leads the current by 90o. Either way the general expression is that the current lags as shown in the vector diagram. Here the current vector and the voltage vector are shown displaced by 90o. The current lags the voltage.
We can also write this statement as, VL = 0o and IL = -90o with respect to the voltage, VL. If the voltage waveform is classed as a sine wave then the current, IL can be classed as a negative cosine and we can define the value of the current at any point in time as being:

Where: ω is in radians per second and t is in seconds.
Since the current always lags the voltage by 90o in a purely inductive circuit, we can find the phase of the current by knowing the phase of the voltage or vice versa. So if we know the value of VL, then IL must lag by 90o. Likewise, if we know the value of IL then VL must therefore lead by 90o. Then this ratio of voltage to current in an inductive circuit will produce an equation that defines the Inductive Reactance, XL of the coil.

We can rewrite the above equation for inductive reactance into a more familiar form that uses the ordinary frequency of the supply instead of the angular frequency in radians, ω and this is given as:

Where: ƒ is the Frequency and L is the Inductance of the Coil and 2πƒ = ω.
From the above equation for inductive reactance, it can be seen that if either of the Frequency or Inductance was increased the overall inductive reactance value would also increase. As the frequency approaches infinity the inductors reactance would also increase to infinity acting like an open circuit.
However, as the frequency approaches zero or DC, the inductors reactance would decrease to zero, acting like a short circuit. This means then that inductive reactance is “proportional” to frequency.
In other words, inductive reactance increases with frequency resulting in XL being small at low frequencies and XL being high at high frequencies and this demonstrated in the following graph:
 | The slope shows that the “Inductive Reactance” of an inductor increases as the supply frequency across it increases.Therefore Inductive Reactance is proportional to frequency giving: ( XL α ƒ ) |
Then we can see that at DC an inductor has zero reactance (short-circuit), at high frequencies an inductor has infinite reactance (open-circuit).
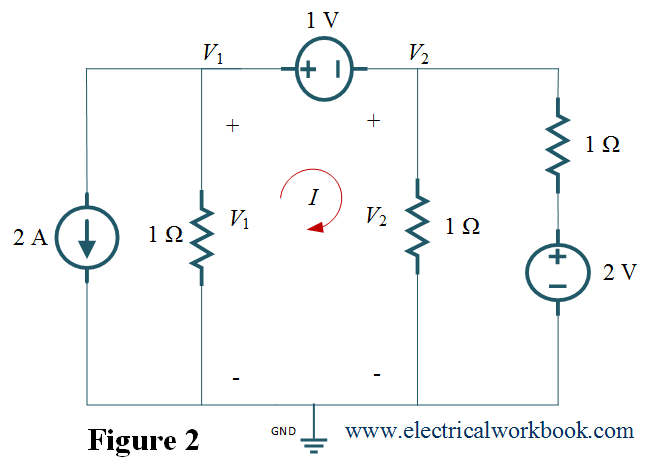
The two nonreference nodes form supernode if the voltage source (dependent or independent) is connected between two nonreference nodes. As shown below in Figure 1, 1 V voltage source is connected between nodes 1 and 2, so node 1 and node 2 forms supernode.
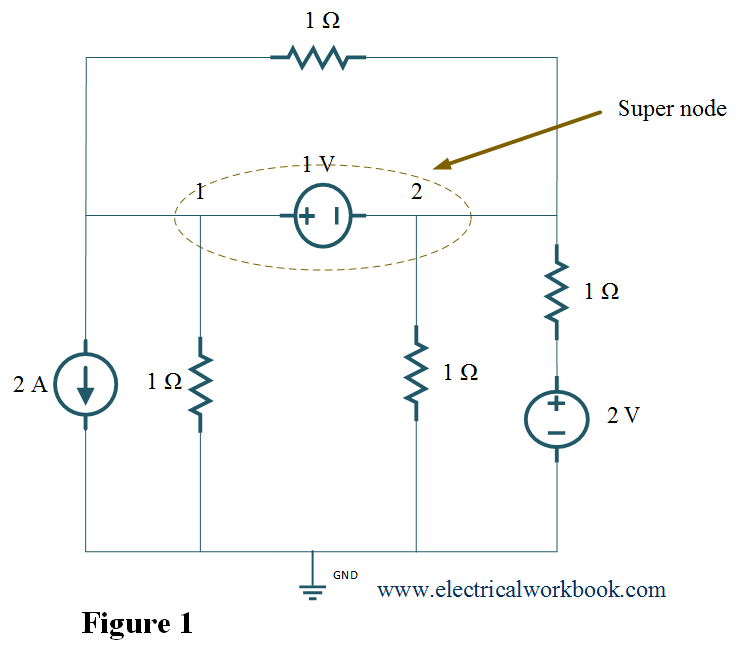
Note:- Apply both KCL and KVL to determine the node voltages.
Example 1. For the given network, find nodal voltages V1 and V2.
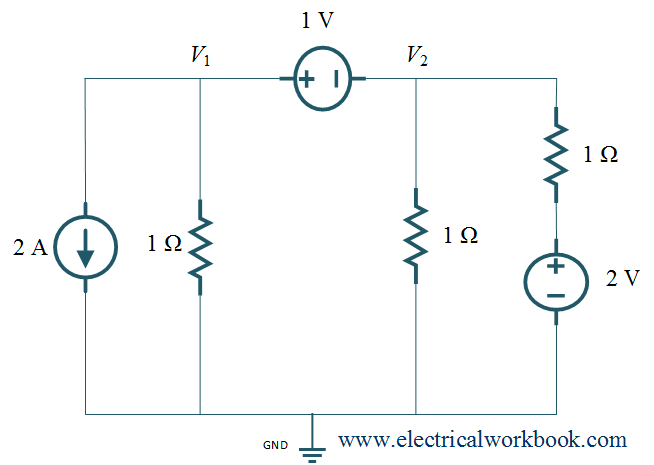
Solution:
As shown in the above Figure, given in the question, 1 V voltage source is connected between nodes 1 and 2, so node 1 and node 2 forms supernode. Thus this problem is based on supernode.
Step 1: – The total number of nodes is 3.
Step 2: – Node 0 is selected as reference node and it is assigned to have ground (zero) potential. The remaining node 1 and node 2 are considered as non-reference node shown in Figure 1. Here, node 1 and node 2 forms supernode.
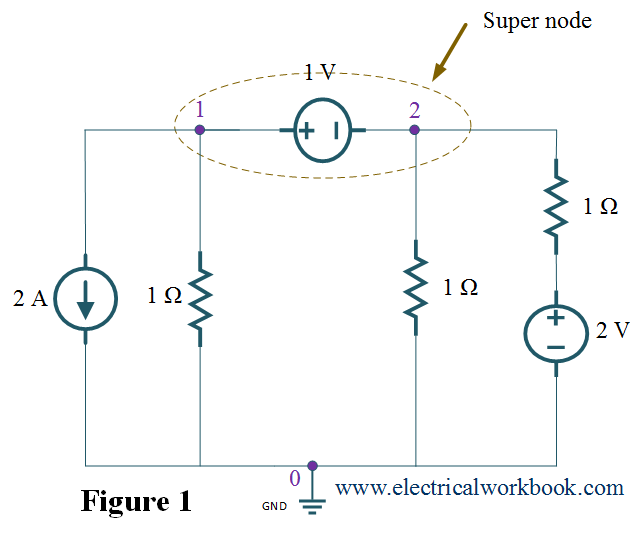
Step 3 and Step 4: – Apply both KCL and KVL to determine the node voltages.
Apply KCL to supernode as shown in Figure 2,
2+(V1–0)/1+(V2–0)/1+(V2–2)/1=0
V1+2V2=0 ……(1)
Apply KVL to the loop having current I as shown in Figure 2,
V1–V2=1 ……(2)
Put Eq.(2) in Eq.(1), we get
3V2+1=0
V2=–1/3 V
From Eq.(1), V1+2V2=0
V1+2(–1/3)=0
V1=2/3 V.
